

Key Highlights
- AI adoption is accelerating faster than workforce readiness.
- Agentic AI shifts employees from doing tasks to supervising AI.
- Safe AI adoption requires judgment, validation, and accountability.
- Realistic simulations build human-in-the-loop skills before live deployment.
- Role-based training prepares employees for their specific AI responsibilities.
- In-app guidance reinforces safe AI practices in the flow of work.
A 98% Completion Rate Looks Great on a Dashboard. It Proves Almost Nothing.
Picture a training dashboard showing 98% completion across the organization. To most stakeholders, that number reads as success. The program ran, people finished, and boxes got checked.
But here’s what that number cannot tell you: whether anyone can actually do the job better than they could before the training started.
For decades, L&D has justified itself through activity metrics: hours logged, modules completed, attendance recorded. Underneath all of it sits a pervasive and expensive fallacy: consumption equals capability. It doesn’t.
Learning leaders are beginning to move away from that. The shift is from measuring completion, whether people finished a course, to measuring competency: whether people can demonstrably perform the work.
This article explains why that distinction matters, what to measure instead of completion rates, and how to make competency measurable at enterprise scale rather than just aspirational.
Why Completion Rates Mislead
Completion Is an Activity Metric, Not an Outcome Metric
Measuring training by completion is roughly equivalent to measuring a hospital by the number of appointments scheduled. It tells you something happened. It doesn’t tell you whether anyone got better.
Completion captures what occurred during the learning process: someone enrolled, someone clicked through, someone finished. It is, in the most literal sense, an attendance record.
What it cannot capture is whether the learner understood the material well enough to apply it, whether their behaviour at work changed, or whether the business is getting anything different out of them as a result.
These are genuinely different questions with genuinely different answers, and completion data cannot reach them. It’s a leading activity indicator that organizations use as though it were an outcome measure, and that mismatch is where the problem starts.
The Kirkpatrick Gap
Donald Kirkpatrick’s four-level model for evaluating training has been around since the 1950s, and it remains the clearest framework for understanding why completion data falls so short.
The four levels are Reaction (did participants feel the training was useful?), Learning (did they actually learn anything?), Behavior (are they doing things differently at work?), and Results (did the business move?). Completion metrics barely reach Level 1. Finishing a module tells you someone was present for the Reaction stage, and maybe some of the Learning stage if there was a quiz involved.
The levels where value actually lives, Behavior and Results, are entirely untouched. Organizations measuring training through completion are essentially evaluating whether learners liked the experience, calling that success, and moving on.
Most organizations know this. The reason they keep measuring completion anyway is simpler than it sounds: completion is easy to capture and competency is not, at least not with traditional tools.
The Downstream Costs Nobody Talks About
When training is measured by completion, leadership has no mechanism to connect it to performance. That’s a big part of why 92% of business leaders can’t see training’s impact. The data they receive doesn’t show impact; it shows activity.
But the failure isn’t just a reporting problem. A workforce that “completed training” but isn’t actually competent generates real operational costs:
- Errors that need rework
- Support tickets from users who can’t navigate the system
- Slower productivity during rollout
The completion metric doesn’t just fail to prove value. It actively hides the competency gap until it shows up as an operational problem, often weeks or months after training was declared complete.
What Competency Actually Means (and How It Differs)
Competency Is Demonstrated, Not Consumed
Competency is the demonstrated ability to perform a task correctly, independently, and to a defined standard. Not the act of having sat through instruction about it, not having watched someone else do it, not having answered questions correctly about how it should be done.
The test of competency isn’t “did they finish the module?” It’s “can they complete the actual workflow, unassisted, without errors?” Those are entirely different measurements. One looks at what happened during training. The other looks at what the person can do after it.
This distinction sounds obvious when stated plainly. The problem is that most training measurement systems are built around the first question, not the second, because the first one is easier to answer. Competency-based measurement requires learners to actually do the work, not just demonstrate familiarity with it.
Is your training measuring activity or actual capability? Score your program in 2 minutes.
Completion vs. Competency: A Direct Comparison
Completion Metrics (Activity) | Competency Metrics (Outcome) |
Did they finish the course? | Can they perform the workflow? |
Attendance and logins | Demonstrated task execution |
Quiz score about the task | Accuracy doing the actual task |
Certificate issued | Competency gate passed |
Hours logged | Time-to-proficiency |
Percentage of modules complete | Error-rate reduction on the job |
Says what they know | Shows what they can do |
The Metrics That Actually Matter
If completion rates are the wrong measure, what should L&D be tracking instead?
- Competency attainment is the most direct: does the person meet a defined skill threshold, as demonstrated through actual task execution rather than a quiz about it?
- Time-to-proficiency tracks how long it takes a new hire or someone changing roles to reach full, reliable performance. This has real dollar value attached to it (more on that in Section 4).
- Error-rate reduction measures whether training led to fewer process failures, quality issues, and compliance incidents in actual work, not in a test environment.
- On-the-job application rate, sometimes called transfer rate, looks at whether skills learned during training are showing up in real work. Manager-observation scores and system behavior data both contribute to this picture.
These metrics map to Levels 3 and 4 of Kirkpatrick’s model: Behavior and Results. That’s where training investment either justifies itself or doesn’t.

How to Actually Measure Competency
Assess the Task, Not Knowledge About the Task
The single most important shift in how organizations measure training is this: stop assessing whether people can answer questions about a workflow, and start assessing whether they can do the workflow.
In practical terms, that means having learners complete the actual task in a realistic environment, scored on whether they did it correctly and without prompting.
Not a multiple-choice question about the approval process. The approval process, performed.
Not a video about how to complete a procurement workflow. The procurement workflow completed step by step, with errors tracked and recorded.
This is where simulation-based learning becomes operationally important rather than just pedagogically preferable. A realistic simulation of the enterprise application allows learners to perform real workflows in a risk-free environment, while the system captures exactly what they did and how well they did it.
That’s a competency measurement. A quiz is not.
How Assima Measures Competency
Assima’s simulation platform is built around this principle. Learners interact with a hyper-realistic replica of the live application and complete actual workflows, scored on accuracy and whether they needed assistance.
The output isn’t “finished” or “not finished.” It’s a competency signal.
Use Competency Gates, Not Completion Checkboxes
A competency gate clears a learner only when they have successfully executed the key workflow, correctly, unassisted, often to a repeatability standard such as performing it correctly across consecutive attempts.
Until that threshold is met, training isn’t considered complete, regardless of how much content they’ve consumed.
This replaces the completion checkbox with something that actually means something. “Training complete” shifts from meaning “watched the module” to meaning “demonstrated the skill.”
That’s a fundamentally different claim, and it’s one that L&D can defend business stakeholders in a way that completion of data never could.
For high-stakes enterprise system rollouts where a mistake in the live system can corrupt financial records or trigger real transactions, competency gates also serve as a risk management function. The organization can confirm, with evidence, that employees were capable before they were given access to the production environment.

Capture Step-Level Proficiency Data
Rather than a binary completion flag, step-level analytics show exactly where in a workflow learners succeed or struggle: which specific steps generate errors, which roles are consistently weak on particular processes, and where competency across the team is thin.
This turns training from a checkbox into a diagnostic.
Instead of knowing that 87% of staff completed the invoicing module, leadership can see that 87% of staff completed the module but 40% are consistently failing at the three-way match step, which happens to be the step most likely to generate audit findings.
That’s actionable. The completion rate isn’t.
Assima generates this step-level proficiency data and exports it to the LMS via SCORM or xAPI, so the system of record finally reflects actual competency rather than just course activity.
The LMS tracks what training happened. Assima provides evidence of whether it worked.
Building a simulation-based training program designed around competency gates is a practical first step for organizations looking to make this shift, and it’s far more achievable than most L&D teams expect once the right tooling is in place.
Track What Happens in the Live System After Training
Competency measured in training is a starting point. The real test is whether it holds up in actual work.
Post-go-live behavior signals, including where users are still searching for guidance, which processes generate the most support tickets, and where error rates remain elevated after training, tell you whether the competency proved in the simulation transferred to the live environment.
In-app search behavior is a particularly direct signal: when users are looking up how to do something they were trained on, competency didn’t fully transfer.
Together, pre-live competency gates and post-live application signals create a complete picture that no completion rate ever could.
One confirms readiness before the system goes live. The other confirms whether that readiness held.
That’s the measurement loop learning organizations need, and it’s the loop that matters to the COOs and CFOs who want training to translate into operational performance.

What Changes When You Measure Competency
The Conversation with Leadership Changes
There’s a significant difference between walking into a budget conversation with “87% of staff completed Q1 training” and walking in with “staff reached verified competency on the new workflow in an average of 14 days, process error rates dropped 22% in the first month post-go-live, and manager-assessed proficiency scores improved from 3.1 to 4.4 across the affected teams.”
The first is a report on activity. The second is a report on outcomes.
Only one of them answers the question a CFO is actually asking when they want to know whether training is worth the investment.
The shift to competency measurement doesn’t just improve L&D’s ability to prove value. It changes the nature of the conversation from defending a budget line to demonstrating business performance.
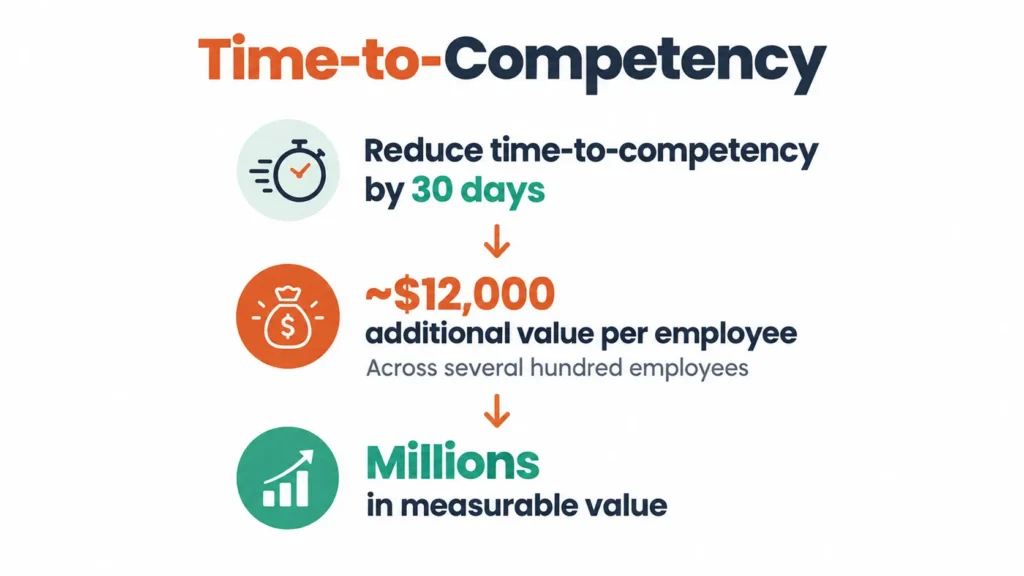
Every 30 days you cut time-to-competency is worth ~$12,000 per employee. See what that's worth for your rollout.
The Hard Dollar Value of Time-to-Competency
Time-to-competency isn’t a soft metric. It has real dollar value attached to it.
Industry research puts the figure at roughly $12,000 in additional value per employee for every 30 days you reduce time-to-competency. Across a large-scale ERP rollout training several hundred employees, shaving 30 days off the average proficiency curve creates millions in measurable value.
That’s a number worth presenting to a CFO, and it’s a number you can only calculate if you’re measuring competency rather than completion. When you know where employees are on the proficiency curve, you can manage and shorten it. When you only know who completed the course, you can’t.
How Assima Shifts the Measurement From Activity to Outcome
Assima measures demonstrated competency rather than course completion. Learners perform real workflows inside hyper-realistic simulations of the live application.
Competency gates confirm they can execute those workflows correctly and without assistance. Step-level analytics show exactly where each learner is proficient and where they still struggle, giving L&D and business leaders granular, defensible proficiency data rather than a completion percentage.
The two systems are complementary. Together they cover the full picture: What training happened, and whether it worked.
The outcome for L&D leaders is straightforward. You stop proving that people showed up and start proving that people can do the job. And proving that people can do the job is the only learning outcome that actually matters to the business.
See how Assima measures competency, not just completion: Systems Training Platform
Frequently Asked Questions
Let’s Answer Some of Your Questions.
No. Completion rates measure activity, specifically whether someone finished a course, not whether they can perform the work. A person can complete a module, pass a quiz, and receive a certificate while still being unable to execute the actual task correctly. They can go back to their desk doing exactly what they did before.
Completion is an activity metric; competency is an outcome metric. To know whether training actually worked, you have to measure demonstrated performance: whether the person can execute the real workflow correctly and without assistance, not whether they clicked through the content.
Because they look impressive and prove almost nothing about capability.
A 98% completion rate signals that people finished the training, not that they can do the job. This is why 92% of business leaders report they can't see the impact of their learning initiatives: the data they receive shows participation, not performance. A metric that cannot answer the question "is the workforce more capable than it was before this investment?" is measuring the easiest thing to track, not the thing that actually matters.
Completion rates reflect compliance and attendance. Competency metrics reflect ability.
Start by assessing the task itself rather than knowledge about the task.
Have learners perform the actual workflow in a realistic environment, scored on whether they executed it correctly and without prompting. Replace completion checkboxes with competency gates that clear a learner only when they have demonstrated the skill to a defined standard. Capture step-level proficiency data showing which specific steps or workflows generate errors.
Then track application after training to confirm competency transferred to real work.
Simulation-based training makes this measurable at scale, turning "did they finish?" into "can they do it?"
The metrics that connect training to business outcomes:
- Competency attainment: does the person meet a demonstrated skill threshold?
- Time-to-proficiency: how quickly they reach full reliable performance
- Error-rate reduction: fewer mistakes, incidents, and rework after training
- On-the-job transfer rate
- Manager-observation scores
These sit at Levels 3 and 4 of Kirkpatrick's model, Behavior and Results, where training investment either pays off or doesn't. Completion rates, attendance records, and quiz scores are useful for monitoring whether delivery happened, but they don't reach capability or business impact.
Measuring competency gives you the ability to manage and reduce time-to-competency, which has a hard dollar value attached to it. Reducing it by 30 days generates roughly $12,000 in additional value per employee, and that compounds quickly across a large rollout.
Beyond that, the measurement shift changes the conversation with leadership. Instead of reporting completion percentages, L&D can report reduced error rates, faster proficiency curves, and measurable performance improvements. That's a language CFOs and COOs understand, and it tends to strengthen the budget case rather than put it on the defensive.
No, it complements it. An LMS tracks the learning record: who enrolled, what was completed, which certificates were issued. Assima provides what that record has always been missing: evidence that learning translated into demonstrated competency.
Learners perform real workflows inside hyper-realistic simulations, competency gates confirm they can execute those workflows correctly, and step-level analytics show exactly where they are proficient and where they still struggle.
That proficiency data exports to the LMS via SCORM or xAPI, so the system of record finally reflects capability, not just course activity. The two systems work together.