
Introduction
E-learning has made it possible to easily track the learning pace and progress of employees even before using the live application, making it possible to personalize learning paths to each individual’s needs so that you get optimum results. It was nearly impossible or highly limited when companies still used static learning methods for software training and adoption. Digital adoption analytics is the foundation for implementing adaptive learning journeys that promote strategic training for your teams. A learning platform with a built-in analytics module like Assima makes it much easier to access enterprise training insights and optimize training accordingly.
What makes the Assima Train platform so perfect for tracking the success of your training program? Explore it in greater detail here.
What is Digital Adoption Analytics?
Now more than ever, enterprises are realizing the need to invest intelligently in providing effective training in software usage to their employees. However, how will you know if the training works? You take advantage of digital adoption analytics to measure the progress of learners and the uptick in performance metrics post-training. Digital adoption analytics refers to the system of gathering usable user adoption data from learning journeys and application of skills at work and turning them into actionable insights, which can be used to lay down the next steps for training implementation.
Without such information, it would be impossible to create a plan for digital learning optimization. If you are on a path to introduce efficiency in user performance through digital transformation, it is essential to gain visibility into whether the training program is working or not. Traditional methods could only give you limited insights through vanity metrics like completion time and rate, change in time required to perform a task, ROI, etc. However, they do not give a complete picture of the impact of training as they leave out the more human factors like engagement, satisfaction rate, application effectiveness, and so on.
A modern analytics system is built to consider both qualitative and quantitative factors in training effectiveness measurement. They treat learning as an experience rather than just a compilation of numbers to measure success and ROI. You are able to look beyond the profit to your business and consider whether your employees gained anything from the training or not.
Where Traditional Training Strategies Fall Short
Traditional strategies are not constructed to provide in-depth enterprise training insights as well as modern methods are, and here’s how:
No Insight into Real-time Application of Learning
Traditional training can only show you the final effect it has had on employee performance and consequently, business KPIs. There is no true visibility into the real-time impact of learning, like retention or problem-solving skills.
No Way to Measure Actual User Engagement
User engagement plays a major role in determining how effective training is. Disengaged learners do not retain information or even grasp the imparted knowledge as well. Traditional training methods do not measure such factors.
Training Is Often Disconnected from User Workflows
Traditional training techniques are hardly ever connected intimately with user workflows, which is where the true impact of learning can be observed. Without such data, there is no way to gauge effectiveness or pinpoint areas of improvement.
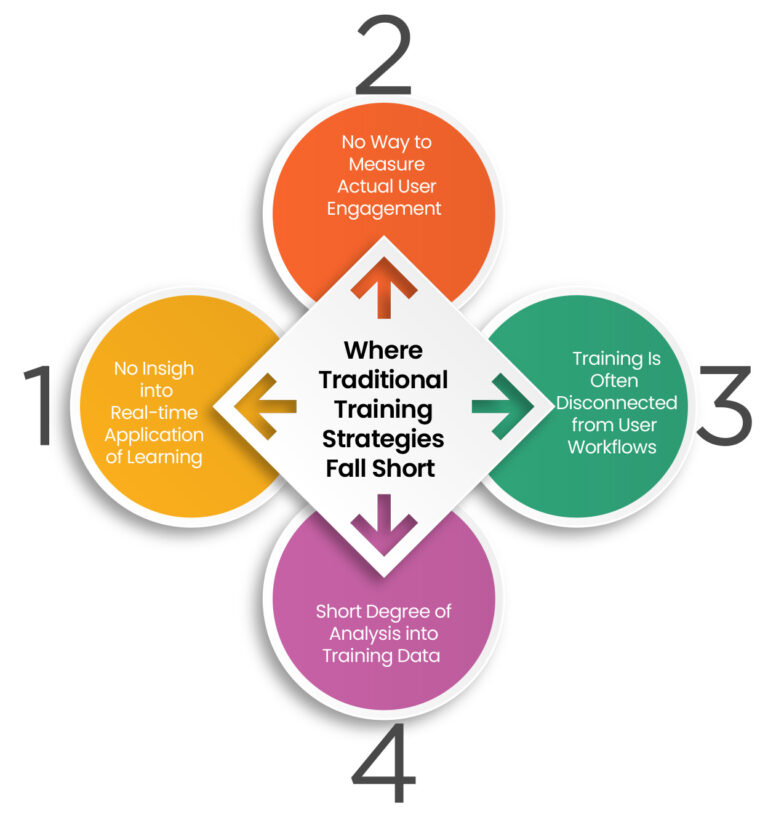
Short Degree of Analysis into Training Data
Modern methods can delve deeply into the true meaning of data gathered during sports. They can analyze this data and create reports on which parts of the training are lacking, and which parts deliver results in a way traditional techniques cannot.
Benefits of Analytics in Enterprise Learning
Digital adoption analytics are essential in measuring the effectiveness of enterprise learning in a large and/or distributed workforce. The benefits you gain include:
Personalization and Modification of Training
Different trainees have different learning needs and preferences. By using analytics, you can customize learning paths based on individual learning paths and paces. This optimizes training for every employee in the way they need, instead of burdening them with a one-size-fits-all solution.
Real-Time Problem Detection and Resolution
Analytics helps you locate problem areas in the training program by inspecting real-time data and gives you the chance to derive a solution and implement it before it’s too late. Whether the issue is with individual learners or the program, you can correct it and shift training back to the right course.
Proactive Support and Better Content Alignment
Training analytics allows you to ascertain if the learning materials effectively communicate the right information in the right manner to the learners. You can optimize training with data regarding which parts of the lesson are working and which are lacking in a proactive manner.
Data-Informed Strategic Planning For L&D Leaders
L&D leaders are responsible for building training programs, planning lessons, and ensuring timely skills improvement sessions. They can decide the course and strategy for creating a training plan by examining data from past and ongoing projects, using it to create strategically aligned training.
Essential Metrics to Monitor
Modern digital adoption analytics use live data capture for user behavior tracking, performance measurement, and ROI. Some of the most important KPIs you can track for any business in any sector are:
Task Abandonment Rates
A major effect noticeable after unsatisfactory training is the abandonment of tasks taught during training. Due to doubts and gaps in knowledge, employees may feel unsure how to complete the task and abandon it midway to ask for help. It is a powerful indication of which lessons were effective, and which were not. It can be calculated as a percentage as (number of tasks abandoned/number of tasks undertaken*100) %.
Time-to-Completion
Training is meant to help employees become more efficient at their jobs. This indicates a lowering in the time taken to complete a task after training compared to before training. Time-to-completion helps you understand if the training program had the desired effect on employee performance and calculate the degree of success depending on the change in the metric for different employees.
Completion Rate vs Pass/Drop-Off Rate
Completion rate refers to the percentage of learners who were able to complete the training compared to the total number of employees who undertook the training. In comparison, the pass rate is the percentage of employees who successfully completed the training and assessment, scoring above the benchmark. The drop-off rate is the percentage of employees who could not complete training and dropped off.
Interaction Depth and Frequency
The interaction depth and frequency of training measure the engagement and involvement of the learner with a learning module. Interaction depth measures the level of interactions with every part of the module, while interaction frequency denotes the number of interactions in each period. Combined with time spent on a module or section, you can judge learner interest and understanding levels.
Requests For Support or Help
A post-training metric, the number or frequency of helpdesk calls, especially in comparison to their values pre-training, is a clear indicator of the level of information understanding and retention among employees. The greater the number of support tickets raised, the less effective the training was. It is important to understand that the average base number of calls and individual performances should be considered before any conclusion.
Training Completion vs. Actual Application
It is important for L&D teams to understand that training completion does not naturally equate to skills development; it is the effectiveness with which employees apply those skills that truly reflects the success of the training program. Often, an inability to transfer learned knowledge to work application is an indication of a gap in the learning materials with the actual actions or a lack of interactiveness in the training.
Other Metrics
While the metrics we discussed above are great for judging the effectiveness of your training solution, they are only representative. You have to keep an eye on other related KPIs too. The digital adoption metrics you choose to follow should be picked based on the needs of the target learner base and the goals and objectives of the business. They should be aligned with the results you are looking to achieve with the training.
Gain deeper insights into how you can witness tangible results in user adoption with Assima.
How Assima Train Uses Analytics to Support Smarter Training
The Assima Train analytics system is designed to give you an accurate picture of the state and impact of your training program. This is how it works:
Assima’s Simulation-Based Training with Embedded Analytics
Assima Train uses interactive, simulation-based training to ensure that employees are trained in the most optimal manner possible. To link the impact of the training to visible, actionable results, it has an analytics module integrated into the training platform that collects all necessary data automatically and feeds it to the dashboard.
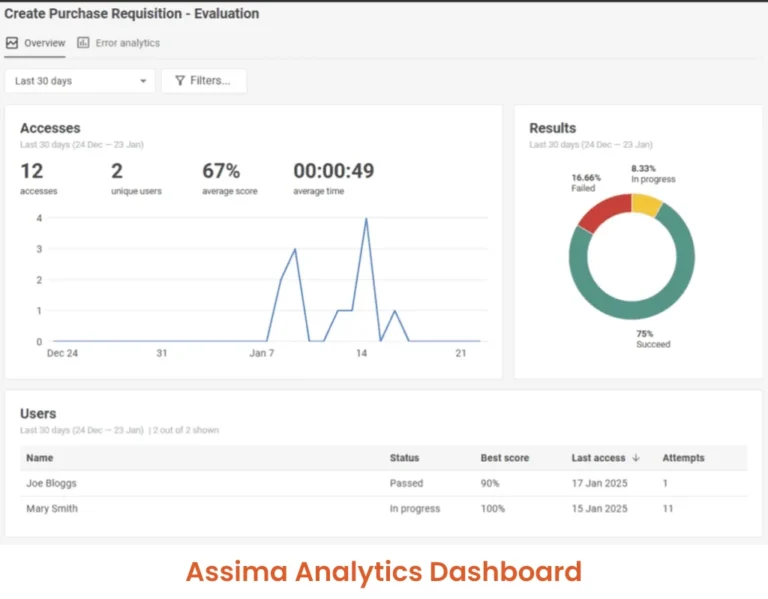
Centralized Dashboard with In-Depth Analytics
All data gathered from training programs created in Assima Train is fed directly to the dashboard, which analyzes and organizes the data into detailed reports and statistics that can help you visualize the effect of the training program and the progress of every user on the system. As an administrator, you can view this centralized dashboard from anywhere with your credentials.
Role-Based Reporting and Progress Dashboards
The Assima platform takes into account the role and access level of every learner who logs in to the platform to intelligently decide their learning path and report their progress accordingly. This makes training efficient and wasteless and allows you to judge the performance of an employee based on their responsibilities and hence, their scope of learning.
Real-Time Progress Reporting for Performance Visibility
The Assima dashboard allows live reporting of user behavior on the learning platform. This is essential for gaining visibility of the real-time behavior of every learner. You understand at which points they are doing well and where there could be obstacles. Based on this information, you can improve the training program or secure greater support for a specific user.
Building a Data-Driven Learning Strategy
Your digital training strategy can only be as effective as you make it, and you can only improve its quality by gaining an understanding of its impact on learners based on solid data. Digital adoption analytics will only provide you with that data; what you do with it dictates how well the training program actually fares on implementation. Listed below are some best practices to see the best results:
Set Benchmarks and KPIs
Unless you have the right metrics to measure the results of your training program, you will not be able to get an accurate picture of whether it is successful. Benchmarks provide an acceptable standard to measure against and inform you of the success or failure of the program.
Use Learner Data to Segment Users
Always segment your learners based on their learning style, department, location, skillset, and other characteristics that have any impact on their learning outcomes. This helps you provide personalized learning experiences to learners for maximum training optimization.
Iterate And Adapt Training Based on Analytics
Once you have inspected the data provided by analytics, you should be able to infer what is working in your favor and what is not. Based on that information, you can repeat the aspects that brought success and modify those parts that displayed subpar results.
Align Learning Goals with All Stakeholders
Employee training must be implemented in a manner that helps your employees in the workplace by making their job easier while also benefiting your company by improving overall productivity. Hence, you should align your training goals to both business and learner expectations.
Track Across the Learning Journey
Only measuring employee performance in the training is not sufficient; you must gather data on their performance, efficiency, and engagement prior to the training as well as after training too. Comparing this data will give you a true picture of the impact of training.
Conclusion
Digital adoption analytics is like a report card for the training program you deploy in your organization. It tells you how the current program fared and shows you what you need to do to improve and refine it. It also helps you identify which employees excel in which areas and need help in which parts, so you can guide them accordingly. A platform like Assima with integrated analytics capabilities makes your job much easier. Using Assima, you can maintain 360° visibility over your training program and give your employees the best learning experience.
Ready to take your training program to the next level? You can do it with Assima!
Frequently Asked Questions
Let’s Answer Some of Your Questions.
Digital adoption analytics refers to the system of gathering data regarding the training, onboarding, and adoption of employees to a new digital technology or software application and using that data to provide insights on the success of the project. You can use this information to locate flaws in the program or aspects that are performing well to modify it and improve its results.
Analytics helps you gather and organize data regarding the performance of both your training program and individual learners. This information can be used to refine the training program, guide learners better, and plan and implement learning strategies geared toward success.
Training effectiveness means different things for different organizations based on the nature of their business, the type of workforce they have, and other factors. You must consider several aspects, like the goals of your company, the needs of your employees, the success criteria for the employees, etc. Some common metrics used by every company are completion rate, pass rate, drop rate, ROI, interaction depth and frequency, support ticket drop rate, etc.
Assima Train has a built-in centralized analytics dashboard that gathers data from every single user interaction and organizes it into visual, actionable insights for your benefit. You get individual as well as role-based training information in real time.
Traditional learning programs are created and modified based on intuition and experience. Modern learning methods employ analytics to obtain real-time data so that the training program can be improved instantly, saving time, resources, and effort.